Data Indicator
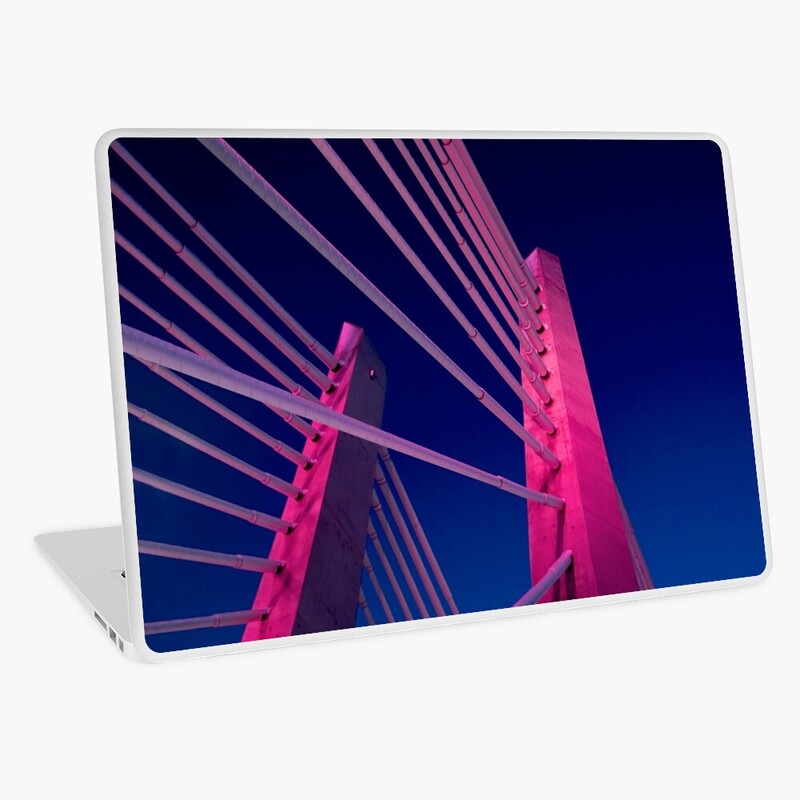
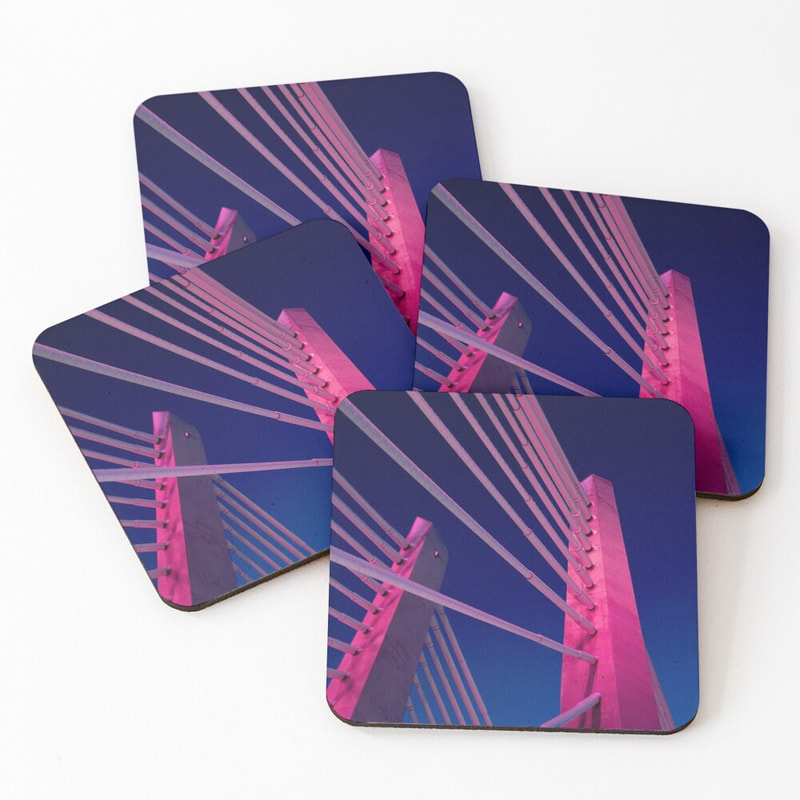
Tilikum Crossing changes colors to reflect the conditions of the Willamette River. USGS and NOAA monitors near the Morrison bridge translate data into light using a program developed by digital artist Morgan Barnard. Water temperature controls colors, and river speed determines how fast the colors cycle through. Light moves toward the center when the tide comes in, and toward then ends as the tide goes out, moving faster closer to high and low tides and slower at the midpoints. River height determines contrast; higher water results in higher contrast.
Photograph was taken in Portland, Oregon, USA.
Image is 4672 × 3104 pixels.
The purchase of this file entitles the buyer to unlimited printouts (at home or through a printing service, such as Walgreens) or wallpaper for personal use only. This purchase does not entitle the buyer to use the image online in any form, to sell the image in digital or physical form, or to use any part of the image for commercial purposes. Copyright remains with the artist.


